

With big, you get stakeholder-specific dashboards that make risks visible, measure progress, and support strategic decisions with a solid foundation.
With big, complex project and asset data is transformed into easily understandable, interactive BI dashboards. All relevant information from various data sources, such as models, documents, lists, or even third-party systems, is automatically integrated to form a reliable foundation for management and analysis. This creates full transparency – both for individual projects and across the entire portfolio.
Transparency and Control across the Entire Portfolio
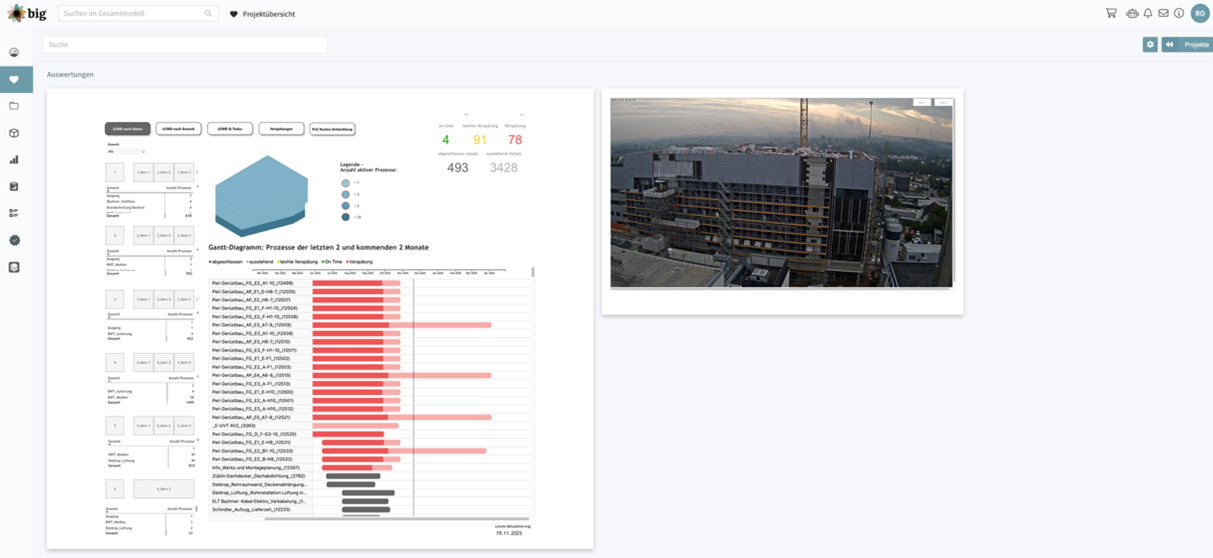
big centrally connects all projects and makes progress, risks, and gaps visible at a glance. The automated consolidation of relevant KPIs minimizes search times and reduces time consuming manual evaluations. This provides executives with a strategically reliable foundation to set priorities, manage investments, and plan resources optimally.
Precise Project Controlling at the Operational Level
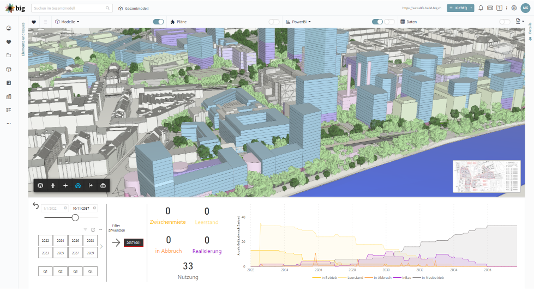
For individual projects, big provides detailed variance analyses, status overviews, and drill-down analyses. Deviations in schedules, quality, or quantities are automatically analyzed and visually highlighted based on new information. Operational project teams can thus respond more quickly, make better-informed decisions, and continuously improve their processes.
big turns scattered information into a manageable, data-driven decision-making foundation. This ensures that every project stays under control – and every portfolio remains balanced.
See “Costs & Quantities with big” and “Design Progress & Quality Control“